I recently develop a web application in and deployed it in Tomcat server. To troubleshoot an issue occurred in the application I wanted to debug my application. For that below are the steps I needed to perform to run my application in the debug mode.
1. Start Tomcat server in debug mode
2. Add a remote debug configuration
3. Debug application.
2. Export below JVM parameters as an environment variable.
1. Start Tomcat server in debug mode
2. Add a remote debug configuration
3. Debug application.
1. Start Tomcat server in debug mode
1. Navigate to Tomcat bin location.2. Export below JVM parameters as an environment variable.
export JPDA_OPTS="-agentlib:jdwp=transport=dt_socket,address=8000,server=y,suspend=n"
Explanations :
Explanations :
- transport [1] - Transport method to use in connecting to debugger application (e.g. IDE) from the virtual machine (Tomcat).
- address - JVM starts and listens on the debug port given as the address.
- suspend - If we set this as 'y' VM waits without loading the main class. (in this case without loading the main class in Catalina which is Catalina's bootstrap) In our case we have set this parameter to 'n' as we need Catalina to start on the given debug port.
3. Start Tomcat given
./catalina.sh jpda start


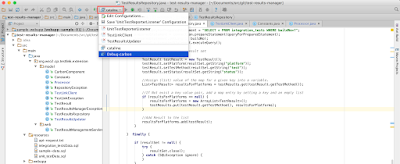
3. When there are multiple debug configurations available, select relevant configuration.
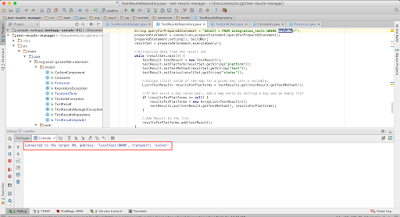
4. Click on debug icon. If everything is configured accurately you will see a message saying Connected target VM with connection information. Then send you can send a request to the web application after adding debug points.
References
[1]. http://docs.oracle.com/javase/7/docs/technotes/guides/jpda/conninv.html
2. Add a remote debug configuration
Note : I have used Intellij Idea as my IDE.
1. Go to 'Run' > 'Edit Configuration' and click on the '+' to add a new debug configuration.

2. Configure remote debugging given the port similar to the address value specified in JVM environment variable.

3. When there are multiple debug configurations available, select relevant configuration.

4. Click on debug icon. If everything is configured accurately you will see a message saying Connected target VM with connection information. Then send you can send a request to the web application after adding debug points.

References
[1]. http://docs.oracle.com/javase/7/docs/technotes/guides/jpda/conninv.html
No comments:
Post a Comment